Hello
=D
posted by edyna @ 1:34 AM
1 Comments
![]()
posted by edyna @ 1:30 AM
1 Comments
![]()
Experiment No. 2 Equipment, Media and Seed Culture Preparation
Experiment No. 3 Inoculation, Fermentation and Monitoring
Experiment No. 4 Isolation and Purification of Product
posted by edyna @ 7:40 AM
0 Comments
![]()
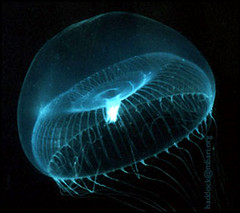
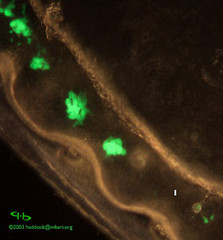
Fig 1: Aequorea victoria
Fig 2: Aequorea victoria photoorgans
(Pictures taken from http://www.conncoll.edu/ccacad/zimmer/GFP-ww/GFP-1.htm)
GFP comprises 238 amino acids (26,9 kDa) and takes on a unique can-like shape consisting of an 11-strand β-barrel with a single alpha helical strand containing the chromophore running through the center. The inward facing sidechains of the barrel induce specific cyclization reactions that lead to chromophore formation, while the tightly packed barrel shell protects the chromophore from quenching by the surrounding microenvironment. Chromophore formation occurs in a series of discrete steps with distinct excitation and emission properties (maturation).
GFP does not require exogenous moiety for fluorescence. It is a naturally fluorescent protein in which the chromophore (fluorophore) is derived from post-translational cyclization of a serine-tyrosine-glycine tripeptide of GFP, followed by dehydrogenation of the tyrosine. This makes it a tremendously useful marker in in vivo studies. In fact, since its original discovery in the jellyfish Aequorea victoria, it has proven valuable in a plethora of biochemical, cellular, and developmental investigations. It is now found in almost all the laboratories in all over the world where it is used in every conceivable plant and animal. Organisms such as E. coli, flatworms, algae, and pigs have all been made to fluoresce with GFP.
GFP are usually much less harmful when illuminated in living cells compared to most of the small fluorescent molecules such as FITC (fluorescein isothiocyanate). This triggered the development of highly automated live cell fluorescence microscopy system for observation of cells over time expressing one or more proteins tagged with fluorescent proteins. Understanding of many biological processes such as protein folding, protein transport, and RNA dynamics, which in the past had been studied using fixed (i.e. dead) material has then been redefined with the analysis of such time lapse movies.
GFP is like the microscope of the twenty-first century where people use it to see when proteins are made and where they can go. This can be done by joining the GFP gene to the gene of the protein of interest so that when the protein is made it will have GFP hanging off it. Light can be shine at the cell and wait for the distinctive green fluorescence associated with GFP to appear. One may thus have an in vivo fluorescent protein which may be followed in a living system. There have been several recent developments for the use of GFP and several different colour variants.
Expression of the protein in small sets of specific cells is another powerful use of GFP, allowing researchers to optically detect specific types of cells in vitro (in a dish), or even in vivo (in the living organism). The GFP gene can be introduced into organisms and maintained in their genome through local injection with a viral vector and breeding. Many bacteria, yeast and other fungal cells, plant, fly, and mammalian cells have been created using GFP as a marker.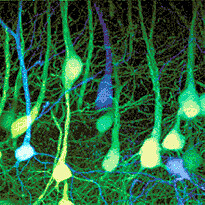
Fig 3: Visually arresting photograph that have been taken of fluorescently labelled proteins.
(Picture taken from http://www.conncoll.edu/ccacad/zimmer/GFP-ww/GFP-1.htm)
posted by Anonymous @ 7:36 AM
0 Comments
![]()
 | 1. Culture desired bacterial strain overnight in LB broth with chloramphenicol (Cm) added to a final concentration of 50 mg/ml. Note: Cm must be added to the growth medium to apply selective pressure on E. coli to maintain the plasmid pHK555 which contains a chloramphenicol resistance gene. |
 | 2. Inoculate 200 µl of overnight culture into 50 ml of LB with antibiotic Cm to final concentration of 50 mg/ml LB in an Erlenmeyer flask plugged with cotton or capped with an inverted breaker. |
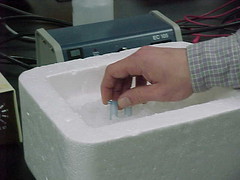
 | 3. Incubate at 37ºC with agitation and monitor culture density with photoelectric colorimeter Note: Examples of the types of photoelectric colorimeter is Spectronic 21 and Klett-Summerson (Baxter Diagnostics, Inc.). |
 | 4. Allow the culture to reach an optical density of 0.35 to 0.50 at a wavelength of 550 nm. Note: This is mid-log phase of growth and generally takes 2.5 hours. This is equivalent to 40-80 Klett units when using a Klett colorimeter. |
 | 5. Pipet 1 ml culture to 1.5-ml Eppendorf tube and microfuge for 2 minutes before pouring off the supernatant. Add a second 1 ml and repeat microfuge and pouring of supernatant. Note: If a microfuge is not available, any centrifuge can be used to pellet the E. coli cells. |
 | 6. Resuspend pellet in 200 ml of frozen storage buffer (FSB). |
 | 7. Incubate on ice for 15 minutes. |
 | 8. Microfuge 2 minutes and pour off the FSB. |
 | 9. Resuspend pellet in 200 ml FSB. |
 | 10. Bacteria are now "competent" and ready for transformation. Note: Competent cells can only be stored in the refrigerator for up to 24 hours or for up to 6 months if stored in a -70°C freezer. The FSB (CaCl2 solution) should be stored at 4°C and made fresh every 6 months. |
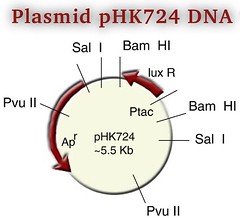
 | 1. Add plasmid pHK724 DNA (5µl) to 50-200µl of competent cells. |
 | 2. Incubate on ice 15 minutes. |
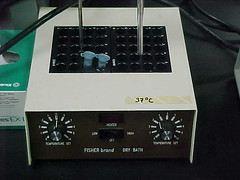
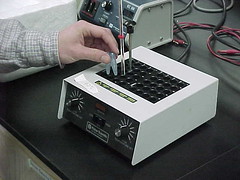 | 3. Place tubes in 42°C water bath for 90 seconds (heat shock). |
 | 4. Incubate at room temperature for 5 minutes. |
 | 5. Add 1 ml of LB and incubate broth at 37°C for 1 hour. |
 | 6. Add 100 µl to selective solid medium. Spread with glass spreader. |
 | 7. If transforming for luminescence, incubate agar plates at 30°C or room temperature for 30-48 hours. |
 | 8. The bioluminescent colonies are viewed in a dark room. Note: It takes about 5 minutes for one's eyes to "dark adapt." |
posted by Anonymous @ 7:34 AM
0 Comments
![]()
posted by iamrrobin :) @ 9:18 AM
0 Comments
![]()
Experiment No. 1 Familiarisation with the Bioreactor and its Operation
Objectives
First day of the practical,everybody "look forward" to this. (Here come the project!!)
Well,luckily our lecturer is Mr Ong (wahaha...)so i guess some girls will enjoy the practicals :P (*ehem* i never mention the names :P)
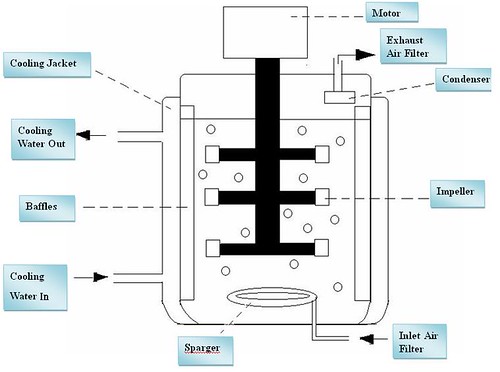
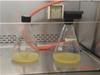
So this is how a fermenter look like :
And the real one will be like this:


| Part of Bioreactor | Part of Bioreactor |
| Motor | Provide energy to the impeller in order to generate it. |
| Impeller | Mix the media by stirring. |
| Sparger | Introduces air in the form of bubbles |
| Baffles | Prevent vortexing of culture. |
| Inlet Air Filter | Remove contaminants; adjust flow rate |
| Exhaust Ait Filter | Filter used air moving out to the environment |
| Rotameter | Measures the flow rate of the air. |
| Pressure Gauge | Measures the pressure. |
| Temperature Gauge | Measures temperature, giving the culture broth an appropriate warmness to maintain in. |
| Coolinng Jacket | Control Temperature |
| pH probe | Measures pH |
| Dissolved Oxygen Probe | Measures the amount of dissolved oxygen |
| Foam Probe | Detect the presence of foam |
| Acid | Added when pH too high (Alkaline) |
| Base | Added when pH too low (Acidic) |
| Antifoam | Add anti-foam agent when foam is present in the fermentor with a peristaltic pump. |
| Sampling Tube | Inoculation, addition of acid or base, and sample removal. |
| Control Panel | Control the two fermentor that is working |
| Level Probe | Measures the level of probe |
Further Questions:
1. State the differences you observe between a microbial bioreactor and a mammalian cell bioreactor.
For microbial bioreactor, cells are able to produce proteins but not in the desired form. The cells are easier to grow in microbial bioreactor. It is cheaper than mammalian cell culture.
On the other hand, mammalian cell culture is more expensive but less hardy. This means that the organisms unable to withstand with strong aeration and agitation when cultured in large scale. The cells are not easy to grow in mammalian cell culture.
2. Study the work flow on page 1 of your laboratory manual. Describe the typical activities that are performed for each stage in the fermentation process.
a) Familiarization with the Bioreactor and its Operationi. Get to know the different parts of the bioreactor and its function.
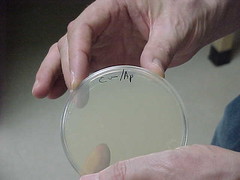
b) Equipment, Media and seed culture preparationi. LB broth prepared to be used as both seed-culture and fermentation media.ii. pGLO transformed E.coli is streaked on a plate to allow multiplication.
c) Inoculation, Fermentation and monitoringi. Transferring cells into fermentor to undergo scale-up fermentationii. Using of computer control system to study the growth of cells.
d) Isolation and purification of producti. Product GFP is confirmed and isolated using enzymes method, freezing and thawing method, and sonication method.ii. A graph is plotted according to the absorbance readings recorded using spectrophotometer set at 476nm (the wavelength at which GFP strongly absorbs and give out its usual fluorescence) to determine the presence of GFP.
posted by Wileen @ 8:22 AM
0 Comments
![]()

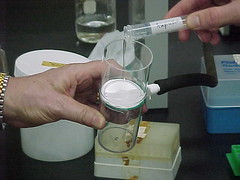
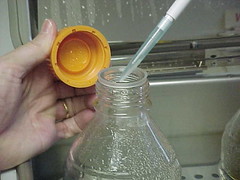
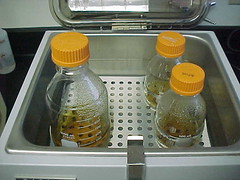
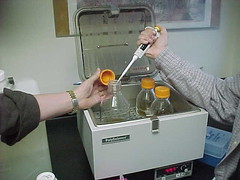
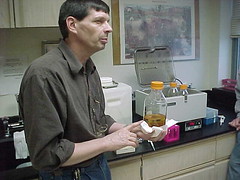
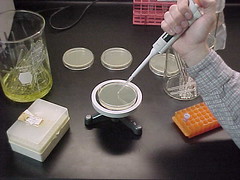
Preparation of Bioreactor

Preparation of Seed Culture


Mr Ong is explainning to us. See how attentive we are!!!! (we just love MR ONG!!!right ida?)photos taken by edyna
Further Questions:
1. On media preparation:
a. Explain the purpose of each ingredient found in the LB media.
Bacto-tryptone: This ingredient provides the necessary peptides and peptones required by the bacterial cells.
Yeast extract: This ingredient provides vitamins and various trace elements required by the bacterial cells
NaCl: This ingredient provides essential ions and contributes to the osmotic stability of the bacterial cells
dH2O: This ingredient is used as a solvent
b. What is the purpose of ampicillin?
The purpose of ampicillin is to prevent the growth of other unwanted microorganisms.
c. Why is ampicillin added only after autoclaving?
Autoclaving will destroy all the microorganisms present in the LB media. Ampicillin is added later to ensure that other microorganisms do not contaminate the medium after autoclaving.
2. On equipment preparation:
a. What is meant by calibration of the pH probe?
Calibration of the pH probe means to correlate the voltage produced by the probe with the pH scale.
b. Why is hydrochloric acid not suitable as a correction agent for pH?
HCL is not suitable as a correction of the pH probe because it is one of the most corrosive acid and it corrodes the metals in the fermenter. Morover,contact between HCL and metals produce hydrogen gas and this creates the chance of an explosion.
c. What is meant by polarization of the pO2 probe?
pO2 probes consist of 2 electrodes, the anode and the cathode, which are both immersed in electrolyte within the sensor body. An oxygen permeable membrane separates the anode and cathode from the water/solution being measured. Oxygen in the solution can diffuse through the membrane. The cathode is the point whereby the oxygen is reduced, and 4 electrons or current is generated directly proportional to the oxygen consumed at the cathode. The electric current generated to measure the amount of saturated oxygen in the solution. However, the reduction of oxygen at the cathode can only happen when the probe is polarized at around 800 mV. Polarization at 800 mV means the difference between the negative cell and positive cell is 800 mV.
d. What is a peristaltic pump?
A peristaltic pump is a type of positive displacement pump used for pumping a variety of fluids.Peristaltic pumps are used to pump clean or sterile fluids because the pump cannot contaminate the fluid and to pump aggressive fluids because the fluid cannot contaminate the pump.
3. On seed preparation:
a. What is the purpose of arabinose?
The purpose of Arabinose is to induce the production of the Green Fluorescent Protein.
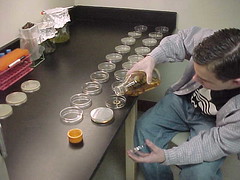
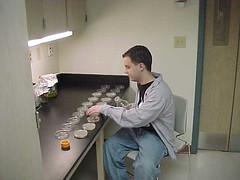
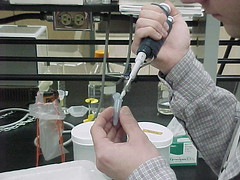
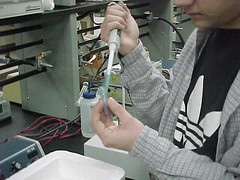
b. Describe the sterile techniques used in seed preparation.
The seed preparation was done in a laminar fume hood, the inoculating loop used to inoculate the bacteria was sterilized over a Bunsen flame and the spreader used to spread the bacteria was soaked in ethanol and sterilized by fire before being used to spread the bacteria culture.
c. Why do we perform step-wise scale-up instead of transferring directly to the fermenter?
Cell culture is scaled up step-wise so as to allow the cells to adapt to the culture conditions .
posted by zhiyuan @ 7:29 AM
0 Comments
![]()

Note:
There are a lot of spikes present in the graphs. This can be due to one of the 2 following causes, or a combination of both.
1) The probe was very sensitive and therefore could detect very minor changes in the parameters involved.
2) The bioprocess was conducted on a lab scale, so there was a low volume of culture. When the culture volume is low, small changes in the parameters can have a big effect on the graph.
pH
At start 7.45, constant for 6hrs aft inoculation, steep increase from 6th to 7th hr. ph increased from 7.45 to 7.60. PH remained constant throughout after 7th hour. The entire experiment lasted approximately 20hrs, inoculation to harvest. From the pH and time, we can tell that during the 1st 6 hrs, the bacterium was adjusting to its environment, there wasn’t any exponential growth observed within the 1st 6 hrs. The sudden increase in pH between the 6th and 7th hr, suggests that the growth phase occurred within that period. The pH then remained constant throughout, this is due to the fermentor system keeping the pH level constant and not that the bacteria had stopped multiplying
pO2
At start 77.0%. a steep drop was observed within the 1st 2hrs of inoculation. At 2hrs after inoculation the amount of saturated oxygen was 15.0%. The lowest saturated oxygen reading was 8.0%. Each time the oxygen level hit the range of 8.0 to 10.0%, it would then shoot up to a range of approximately 30.0 - 40.0%, this was observed from the 2nd hr of the experiment onwards till the end of the experiment. The rises and drops on pO2 percentage is caused by the fermentor system, as it tries to keep the consistency of the saturated oxygen level. Each time the level falls below a certain range, it compensates the drop by increasing the saturated oxygen level. This produces spikes in the graph. Spikes were observed along the gradient of the graph throughout the experiment. The saturated oxygen content is increased by increasing the stirrer speed (rpm).
Stirrer speed (rpm)
At start, 167rpm. Remained at this speed for 1st 2hrs, and then began to increase, its fastest speed observed was approximately 470rpm. The stirrer speed is tightly linked with the saturated oxygen content, each time the saturated oxygen content fell below a certain range. The stirrer speed would increase to have more oxygen saturated within the culture. The pattern of stirrer speed was opposite that of the oxygen saturation graph.
Record of Culture Absorbance and Fermenter Parameters
Sample | Hours | OD600 | Log(x/x0) |
Control | 0.0 | 0.000 | - |
1 | 1.0 | 0.140 | 0.140 |
2 | 2.0 | 0.459 | 0.226 |
3 | 3.0 | 1.004 | 0.335 |
4 | 4.0 | 1.238 | 0.310 |
5 | 5.0 | 1.658 | 0.332 |
6 | 6.0 | 1.820 | 0.303 |
7 | 7.0 | 1.872 | 0.267 |
8 | 8.0 | 1.928 | 0.241 |
9 | 9.0 | 2.015 | 0.224 |
10 | 10.0 | 2.035 | 0.204 |
Discussion of graph of log x/x0 against time

Log x/x0 values were obtained by dividing the OD600 (x) reading by the no. of hours into the fermentation. 10 such values were obtained by taking the OD600 of samples taken hourly after the fermentation had begun, equivalent to growth rate against time.
OD600 readings of the sample showed an increase over the hours, indicating an increase in cell density.
By plotting log x/x0 against time, we can visualize the cell’s growth rate over that period of time. For the 1st hour, no cell growth was observed. During this period of time, the cells are probably adapting to their new environment, thus are not multiplying. From the 2nd to the 4th hour, exponential growth is observed. Fueled by media rich in nutrients, growth rate of the cells is increasing rapidly, the gradient of the graph is at its steepest. The cells have adapted to the environment conditions thus the optimal growth. From the 4th to the 6th hour, the curve’s gradient dropped and then increased again later, at the point where the graph hit before the slight drop is where optimal growth rate was observed, the slight drop in growth rate could be due to the fermentor reaching its maximum capacity of cells, thus the culture cannot keep increasing its growth rate but to maintain it, keeping their numbers. From the 6th hour on, the curve displays a gradual drop in its gradient, this shows a negative growth rate, which means, cells are dying faster then cells are cells are being produced, many factors could contribute to this, e.g. overcrowding and exhaustion of nutrients in media.
Further Questions:
1. Explain the control philosophy for pH, temperature and dissolved oxygen as was used in the fermentation process.
pH- as the bacteria culture grow, wastes are generated and the pH of the culture goes out of consistency. The pH may increase or decrease depending on the culture species. Acid and bases are added into the fermentor in certain amounts to keep the consistency of the pH. If the pH drops below a certain level (becomes too acidic), base is added in to return pH to its optimal level, if the pH rises above a certain limit (becomes too basic), acid is added in to get back optimal pH.
Temperature- there is an optimal temperature for the growth of the bacteria culture, fluctuations will not produce optimal growth. Therefore, the temperature has to be kept consistent (optimal temperature). Many processes emit heat, e.g. running motor of stirrer, and exothermic chemical reactions that occur within the fermentor etc. the temperature of the fermentor is kept constant with the help of a cooling jacket. The cooling jacket surrounds the fermentor. Water is pumped into the jacket from one end and out from another end, this way, water runs around the jacket surrouding the fermentor, carrying the heat emitted out of the system.
Dissolved oxygen- as the culture grows, oxygen content within the media is depleted. The culture will die off if the oxygen content is not replenished. Oxygen is dissolved into the media from the atmosphere, this is done with the help of a stirrer, as the stirrer spins the culture, oxygen from the atmosphere dissolves into the culture. The faster the stirrer speed the more oxygen is dissolved into the culture.
2. Describe the principle of the spectrophotometer which was used to determine the cell density (OD600). Why was 600 nm used?
A beam of light (of certain specificity e.g. wave-length) is emitted. The light passes through a cuvette where the sample is placed. Some of this light is absorbed by the sample and some pass through (transmitted light) hitting the detector on the other side. Transmitted light is then converted by a programme into absorbance values. The wave length of the light emitted by the spectrophotometer in this experiment is 600nm. 600nm is used as it is the most appropriate wave length to measure the bacteria. Bacteria fall under a certain range of sizes, this certain range of sizes can be picked up best by a wavelength of 600nm. If the wave length is too small, e.g. in the 200 range, the spectrophotometer may pick up other particles together with the bacteria, such as DNA and proteins, if the wavelength is too big, the spectrophotometer may not pick up the bacteria at all.
3. Is GFP a primary or secondary metabolite? At which phase should the product be harvested? At which phase was the product actually harvested?
GFP is a secondary metabolite. It is not directly involved in the cell’s growth, development and reproduction. The cell can still survive in the absence of GFP Trophophase is a period in cell culture where cell growth is still taking place and primary metabolites are being produced. Idiophase is the period in cell culture in which stationary growth is observed, this is the period where secondary metabolites are formed. GFP is produced in idiophase.
4. What are some advantages of using a computer control system? From the history chart (which will be given to you by your supervisor after the fermentation), comment on the effectiveness of the computer control.
Computer system can make visualizations, interpreting results so that it makes sense of the given mass of data, thus making it easier to understand (such as that of the history chart). A computer control system is also automated. Routines once vigourous to the lab technicians are made convenient by the programmes embedded within the computer control system e.g. temperature readings, maintenance of pH and saturated oxygen content. Also, errors are minimized as human error is eliminated almost completely (but they can still happen).
posted by Yiju @ 8:01 AM
0 Comments
![]()
Isolation and purification of product
A. Isolation


B. Purification
Absorbance readings
Fraction | OD476 |
Blank | 0.0 |
1 | 0.054 |
2 | 0.200 |
3 | 0.097 |
4 | 0.015 |
5 | 0.074 |
6 | 0.057 |
7 | 0.000 |
8 | 0.012 |


(This is how our GFP look like.nice?heez)
Further Questions:
1. Plot a graph of your A476 absorbance values (Y-axis) vs fraction number. Comment on your chromatogram.
Generally, the higher the concentration of absorbing substance, in our experiment the green fluorescent protein (GFP), the greater the amount of light that will be absorbed, that is a high absorbance reading will be reflected. From the graph above fraction 2 had the highest absorbance and this means that most of the GFP was collected in this tube. The absorbance for the first fraction is low because when the sample was first added to the column it takes time for the sample to reach the other end of the column. Therefore, the 1st tube would contain mostly ammonium bicarbonate. Starting from fraction 2, the GFP will start to elute. Therefore, the absorbance value increases to a peak and thus, this means that most of the GFP have been eluted. Finally, other fractions will have lesser GFP in it, and the absorbance decrease significantly.
2. GFP has a Mr (molecular weight) around 27,000 kD. Though we were unable to see them, the cell free extract also contained hundreds or even thousands of other proteins. Do you think a protein with a Mr of 50,000 kD would elute in a fraction before or after GFP? Why or why not?
A protein with a Mr of 50,000 kD will elute in a fraction before GFP, which has a Mr of 27,000 kD. This is because in size exclusion chromatography, as the proteins travel down the column, high molecular weight proteins will flow through faster whereas the low molecular weight proteins will spend more time interacting and diffusing into the pores of the gel resins. Hence this slows down their flow rate.
Learning points of fermentation in general
Fermentation involve in a process whereby cells convert a substrate into valuable products. There are different modes of fermentation used in industrial fermentation, for instance batch, fed-batch and continuous fermentation. Continuous fermentation is commonly used nowadays. Fermenter culture in industrial capacity often refers to highly oxygenated and aerobic growth conditions. Most industrial fermentation uses aerobic fermenters because it ensures adequate mixing and proper aeration by impeller and sparger.
posted by Sairam @ 8:51 AM
0 Comments
![]()
|
|